Performance Window
The core functionality of EasyPerformanceMonitor revolves around performance monitoring. So the performance window serves as the primary element, capturing and displaying data like frames per second (FPS), CPU and GPU usage, presented in graphs and texts.
Through the default prefabs two variations are available: the "normal" monitor, designed and optimized for desktop and consoles, is slightly more comprehensive in its monitoring capabilities. And the "compact" monitor optimized for mobile screens.
Within the performance monitor, three essential components make up an element. These include one or multiple data providers, a graph renderer, and a text renderer. Let's dive into a practical example to better understand these components, using the FPS element as illustration.
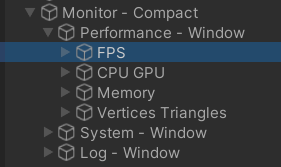
In the hierarchy you find the FPS element under the performance window.
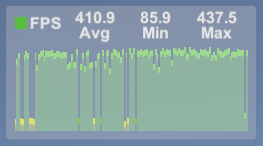
This is an example of the renderer FPS element in the overlay.
Provider
A provider fetches the data intended for rendering in either a graph and/or text format.
In the context of the FPS element, it incorporates a single provider (although multiple providers can be used simultaneously if desired), known as the FPS Provider.
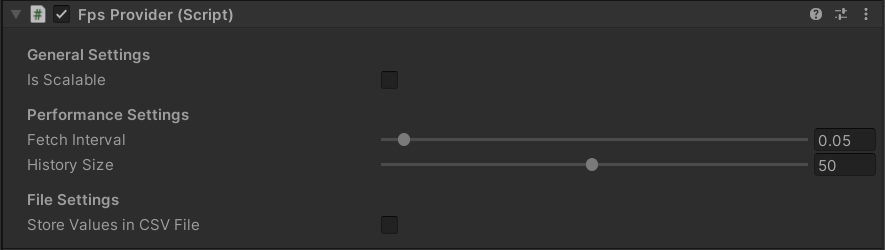
The frames per second data provider.
Settings allow you to customize the frequency of FPS data retrieval per second, also determine the storage capacity for historical data (used to calculate metrics like mean, min, max).
Provider data is scalable, accommodating thresholds for representing higher values with larger units. For instance, in the case of memory, you have bytes (B), kilobytes (KB), megabytes (MB), gigabytes (GB), and so on, each scaling by a factor of 1024. However, for FPS, this scaling is unnecessary and can be disabled.
Additionally, there is an option to activate the "Store as CSV File" checkbox, allowing the saved data to be stored in a persistent file for further analysis.
Graph Renderer
A graph renderer translates the provided data into a visual graph, and there are multiple types available. The rated graph renderer permits the customization of graph colors based on specific thresholds, associating colors like green for good, yellow for warning, and red for bad. This feature aids in quickly identifying performance levels.
The normalized graph renderer, on the other hand, requires multiple providers and normalizes the sum of the provided data for effective comparison. For instance, in optimal conditions, you might want both CPU and GPU to contribute equally to frame time, resulting in a normalized value of 0.5 (50 percent) for each.
Additionally, a colored graph renderer is available, providing a consistent color for all values on the graph.
Returning to the example of the FPS element, it utilizes a rated graph renderer, signifying that higher values are desirable, as more frames per second are generally better. The renderer includes predefined thresholds for different devices, marking data points with specific colors when warning or critical thresholds are reached.
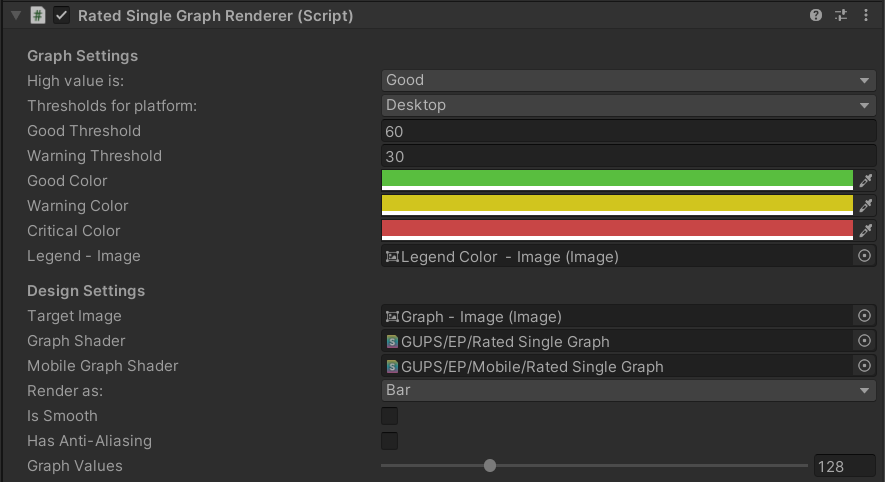
The frames per second graph renderer.
Text Renderer
The text renderer serves the purpose of presenting provided data in textual format. Similar to the graph renderer, there are rated, normalized, and colored text renderers. These text renderers function similarly to their graphical counterparts, but they primarily display mean, min, and max values as text. Optionally, they can also present the provided data in a scaled format if desired.
Returning to the FPS element as an example, the text renderer in this context does not require any scaling or suffix (such as 'FPS' next to the mean/min/max values). It straightforwardly displays the mean, min, and max values.

The frames per second text renderer.