Description
Easy Performance Monitor is an in-game performance tool for Unity. It sits on top of your game as an overlay and shows you performance data while the game runs, so you do not have to pause or leave the device you are testing on.
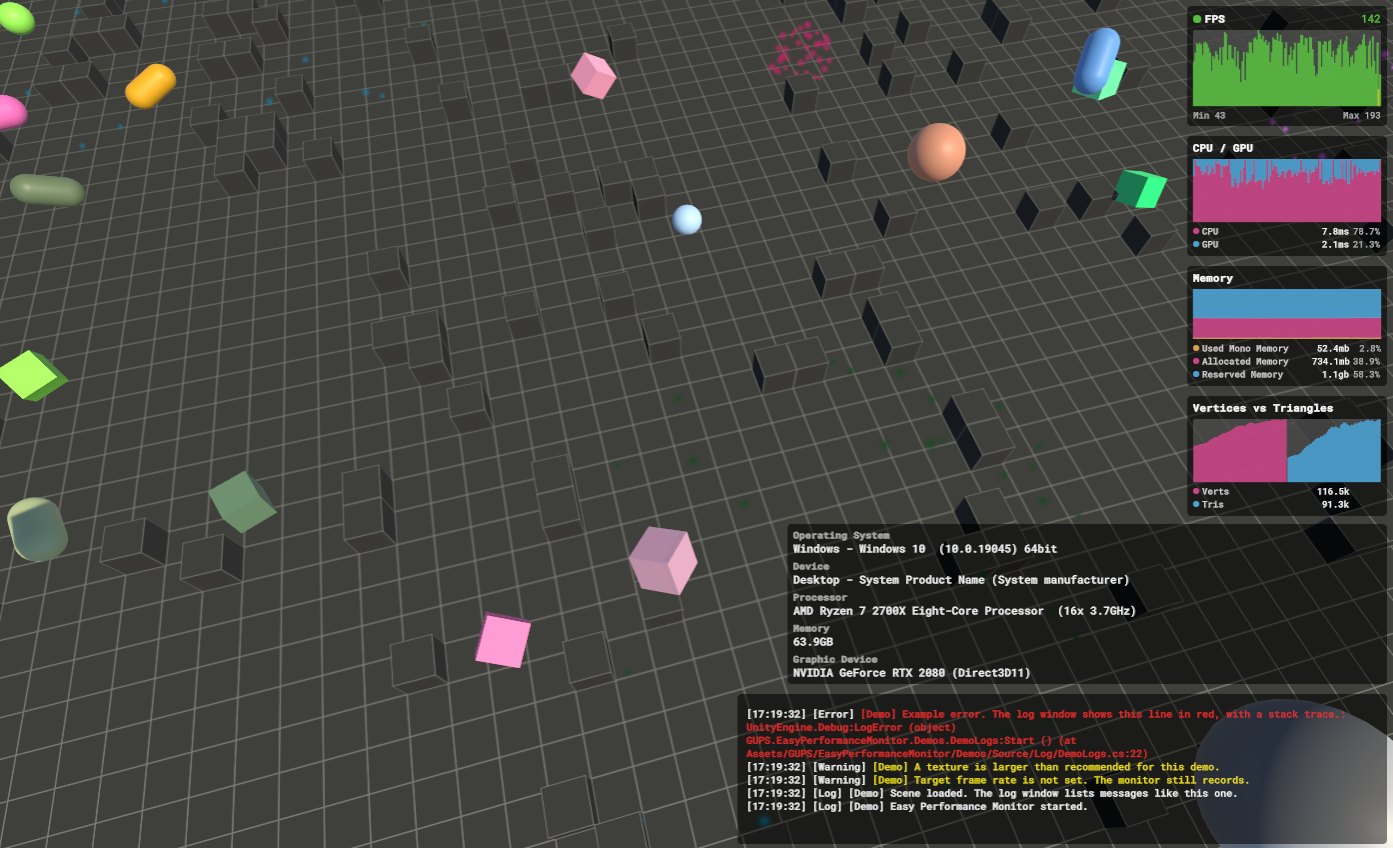
One possible layout. The graph cards sit along the top, system info is in the corner, and the log fills the bottom. You can also show fewer cards, a small panel, or a monitor that floats in the 3D world for AR and VR.
What you can open
The tool is a set of windows, and you can show one of them or several at once.
Performance graphs is the main window. Every number you track gets its own card with the current value, a live graph, and the lowest and highest values from the recent past. When you create this window from the menu, it starts with frames per second (FPS), CPU and GPU frame time, and memory, and you can add more cards whenever you need them.
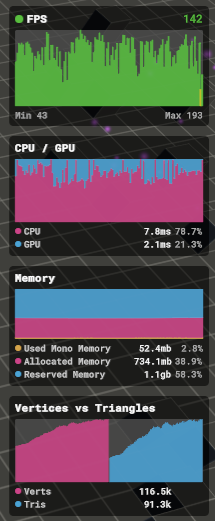
Four cards stacked in a column: an FPS card that changes color with the frame rate, CPU and GPU time on one graph, three memory values with their share in percent, and vertices next to triangles.
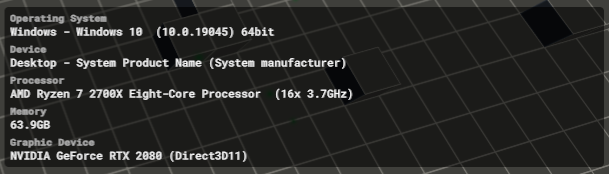
System info tells you about the device that is running the game: the operating system, the device model, the processor, the memory, the graphics card, and the graphics memory. It is handy next to your graphs when you test on different phones, PCs, or consoles, because you always know which device the numbers belong to.
The log brings the Unity Console into the game. Messages, warnings, and errors show up as they happen, and errors include the stack trace so you can see where they came from. That is a big help on a phone or a console, where the Unity Editor is not around to show you.
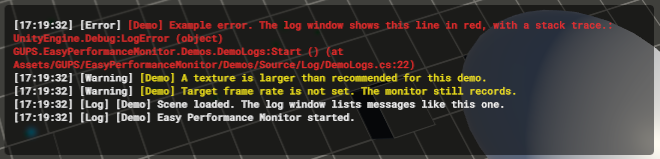
Each line starts with the time and the kind of message. Errors are red, warnings are yellow, and normal messages are white.
The windows to start with
Easy Performance Monitor supports both the older uGUI and the newer UI Toolkit. We recommend the UI Toolkit windows, because they perform better and look better. They are also the default when you create a window from the menu.
Both systems have their own prefabs and components, and they live in their own folders:
- The Legacy folder holds the older uGUI windows. The Classic windows page covers them.
- The UI Toolkit folder holds the new UI Toolkit windows.
Ready layouts
You can create a window from the Unity menu, or drag in a prefab. These UI Toolkit prefabs are included:
- Monitor is the full set and fits PC and console screens.
- Monitor - Compact is smaller and fits phones.
- Monitor - Tiny is a single small panel. See the Tiny monitor page.
- Monitor - Minimalistic - Variant 1 and Variant 2 pack more numbers into less space.
- The VR folder has monitors you can place in the world.
Extra graph cards live in a Components folder. Drop one onto the performance window and that number shows up as a new card. The Add a number page lists them.
Numbers you can watch
These measures are already built in, so you only turn on the ones you care about.
- FPS is frames per second. Higher means smoother.
- CPU time and GPU time tell you how long a frame takes, in milliseconds. Lower is better.
- Memory covers allocated memory, reserved memory, memory used by your scripts, and memory the app can still use.
- GPU memory is memory on the graphics card. The allocated GPU memory reading works in the Editor and in development builds.
- Draw calls, triangles, and vertices show how much the GPU is drawing each frame.
- Download and upload are your network speed.
- Ping is network lag in milliseconds. It works on PC, mobile, and consoles, but WebGL cannot send this kind of ping.
- Unity Profiler reads one counter you pick from Unity's profiler. This needs the Unity Profiler to be active, which is the case in development builds.
- GameObject Tag Count counts objects in the scene that use a tag you choose.
You can also feed in your own number, such as the player count or the number of enemies alive. The Custom data page shows how.
The graphs
There are several graph types to choose from. You can draw data as a line or a bar chart, and you can put several numbers in one graph, such as CPU time and GPU time together. Those numbers can be drawn on top of each other, side by side, or stacked as shares of one total.
A graph can use a single color, or it can change color as the number gets better or worse. Green usually means fine, yellow is a warning, and red means trouble.
You set the limits yourself. FPS might stay green above 60 and turn red below 30, for example. Because a phone, a PC, and a console are not the same, you can set different limits for each of them.
Save it and look later
Live graphs are great while you play, but files are better when you want to study a session afterward.
- Each performance card can save its samples to a spreadsheet file (CSV).
- The system window can save the hardware list to a text file.
- The log window can save every message to a text file.
Unity stores these files in the app's persistent data folder on the device.
How you control it
Each window has its own key to show or hide it. These are the defaults:
- F1 shows or hides the performance graphs.
- F2 shows or hides system info.
- F3 shows or hides the log.
You can change any key in the Inspector. Both the new Input System and the old one are supported, and if your project has both turned on, the new one is used. Clicks pass through the windows, so you can keep playing with the monitor open.
AR and VR
You can render any window into the 3D world. A flat panel appears in the scene, and you move it like any other object. That is the comfortable way to read the monitor in AR or VR, where a flat screen overlay is hard to look at.
The AR and VR page explains the picture size and the panel width.
Where it runs
Easy Performance Monitor runs on the major platforms: PC, mobile, and consoles.